
Turn Data IntoBetter Decisions
Raw numbers don't drive growth—understanding does. TimeMagick transforms your time, project, and team data into clear, actionable insights that help you work smarter and bill accurately.
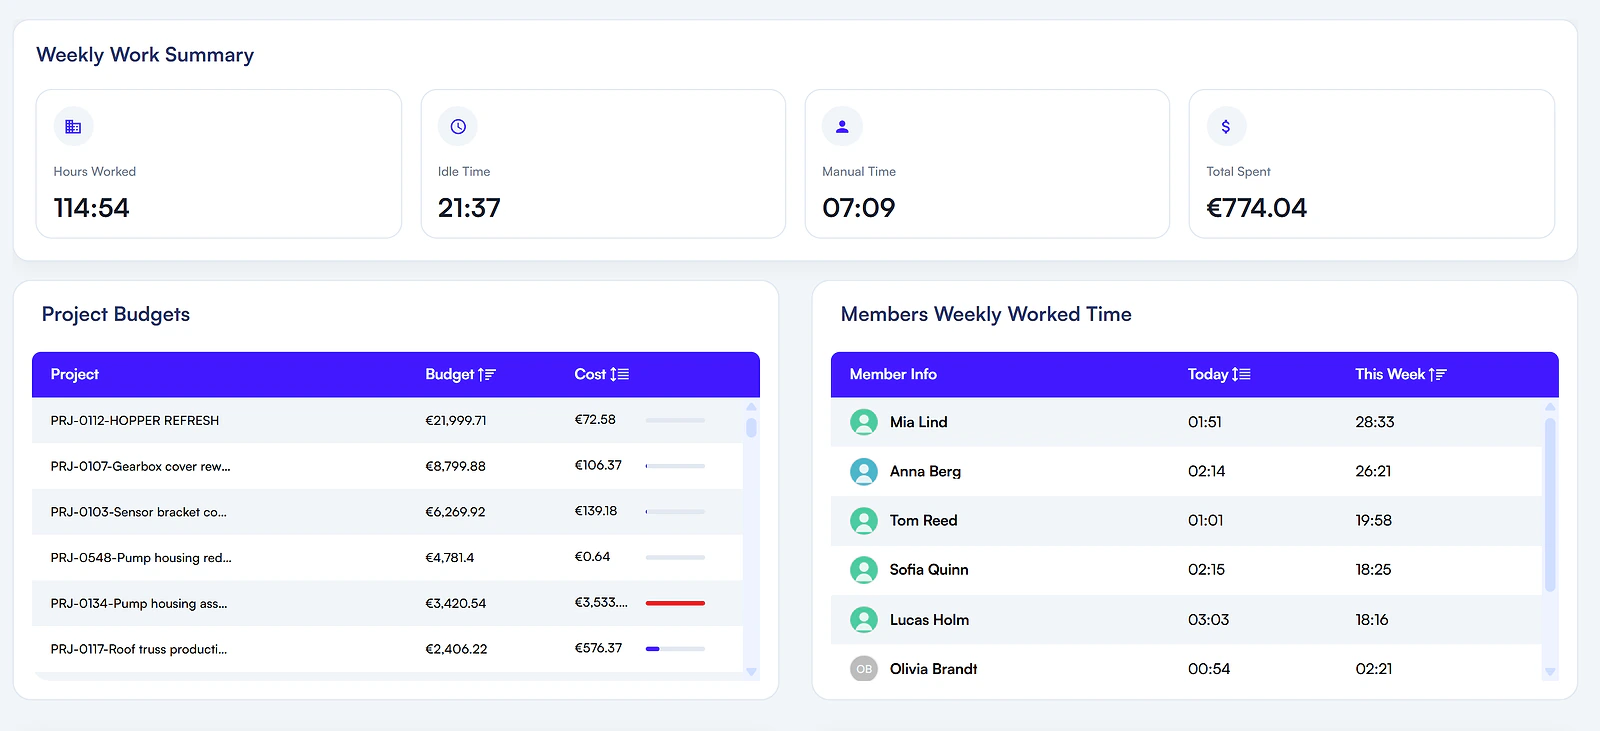
Individual Performance Reports
Each team member gets a detailed work summary — hours logged, tasks completed, productivity trends, and more. Perfect for 1-on-1 reviews and personal goal tracking.
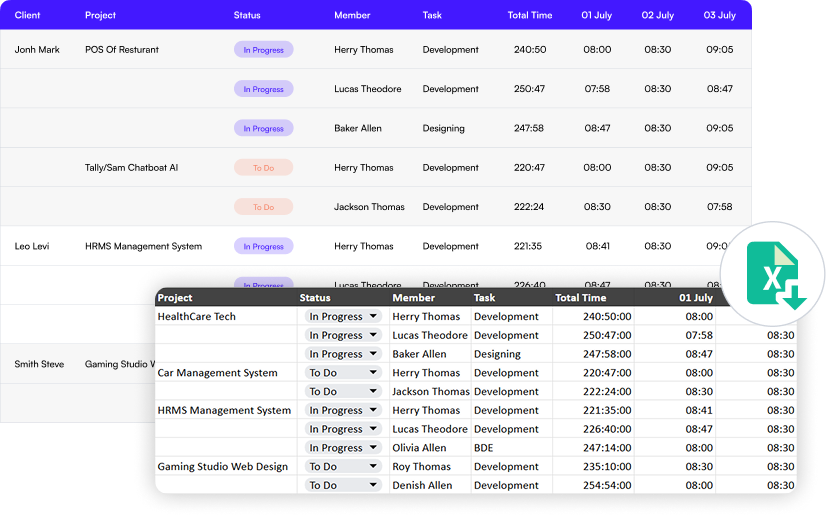
Detailed Project Reports
Export the project report as a formatted Excel file: client, project, task, status and total hours, with worked hours for each day of the period, grouped by project and task with subtotals and totals.
Invoices & Billing Reports
Approved time flows into Project Billing, where billable and billed hours are compared per client and project, and into invoices with duration-based and quantity-based lines, downloadable as PDF.
See billing & invoicing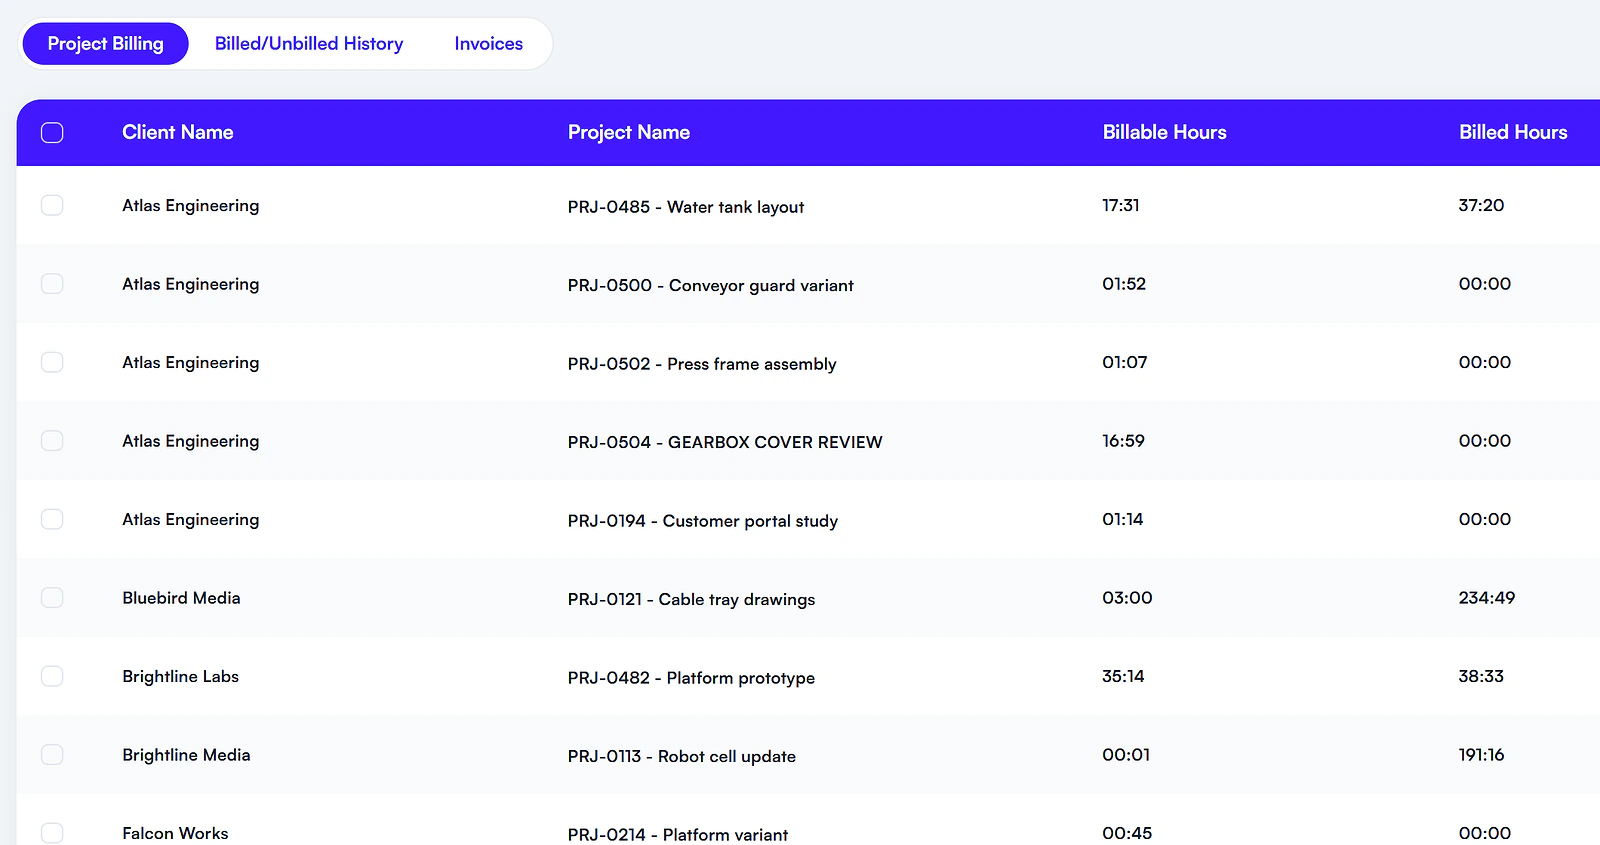
Reporting Features
From quick overviews to deep dives, every report is designed to give you clarity fast.
Looking for profit, margin or client health rather than hours? See Profitability
Visual Dashboards
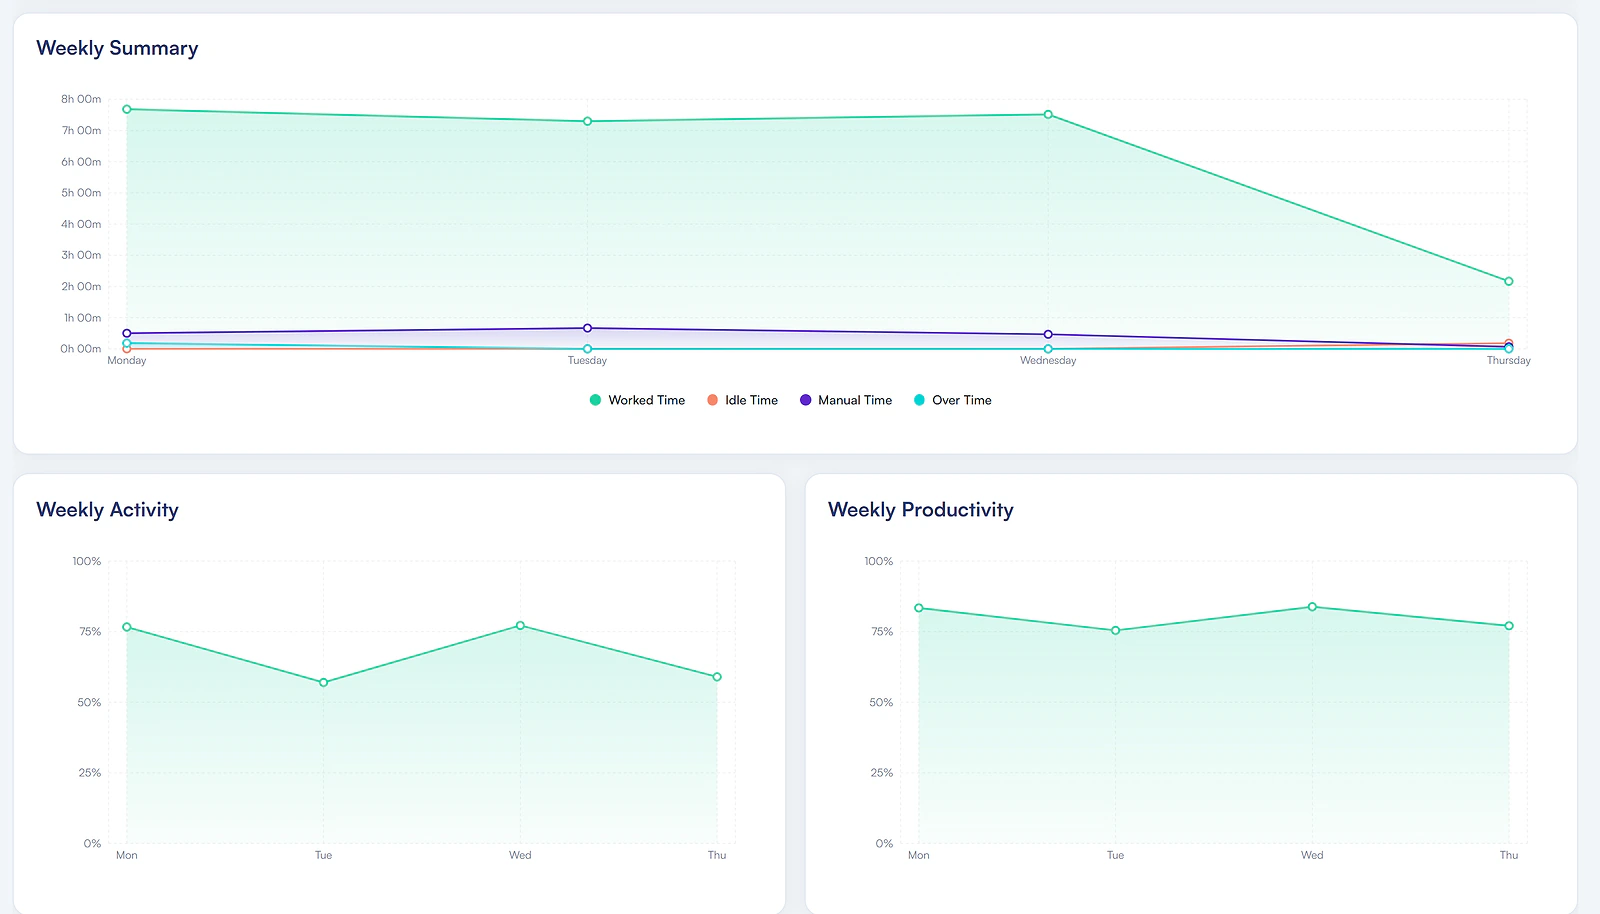
Interactive dashboards that surface your most important metrics. See productivity, project status, and team performance in one view.
Six Filterable Reports
Client Gantt, client by days, client detailed, member, project, and company & recurring expense reports, filtered by client, project, member, status or date range depending on the report.
Flexible Exports
Export reports as formatted Excel files, ready to share with clients or accounting. Export is its own permission, so people can view reports without being able to extract them.
Trend Analysis
Revenue, profit, billable vs. non-billable hours and client activity trends live in the Profitability module, next to margin and Client Health.
See What Your Data Is Telling You
Start making smarter decisions with reports built on your own project data. Free for 30 days.